Popularity UI-filter

Popularity UI-filter

My Role

Project Name: Provider Mapping Manager
Duration: 8 hour
Role: Product Designer

Overview

I worked as a Product Designer for a client in the online sports betting industry. The project involves introducing new Filter UI in order to retrieve data from the popularity algorithm.

Problem Statement

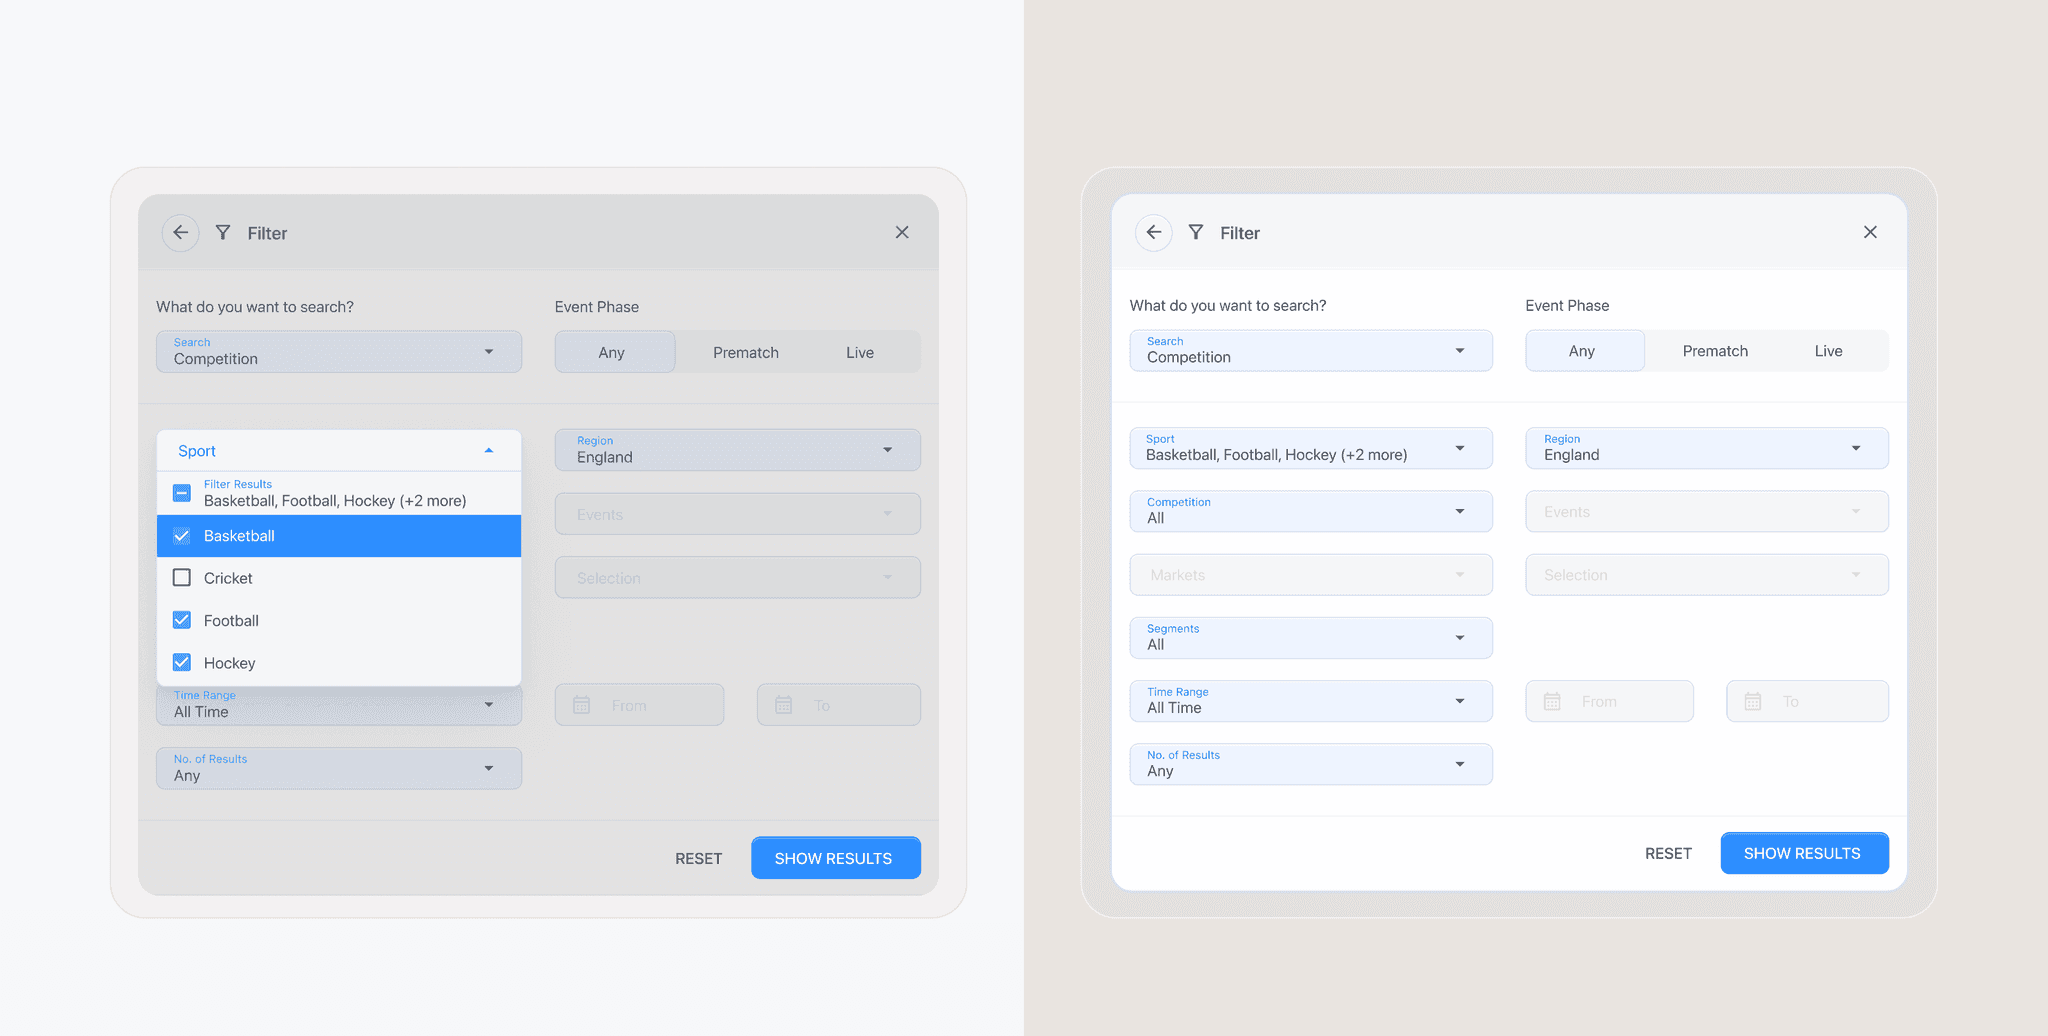
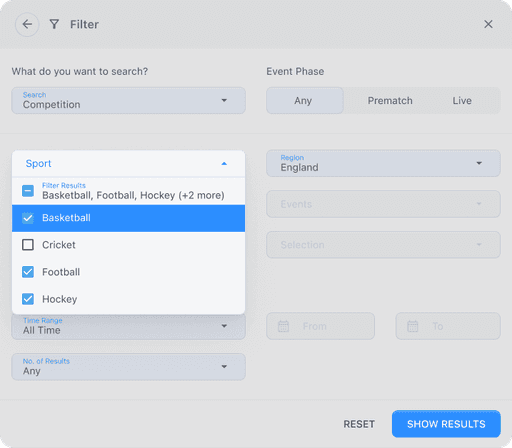
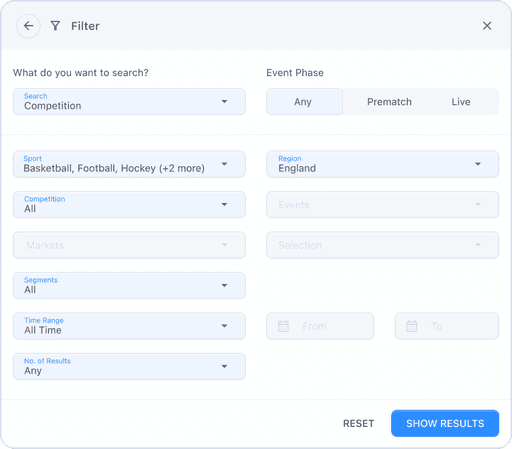
To design a user interface (UI) that allows Sportsbook users to filter and view popularity data i.e. the popular sports, regions, competitions, events, markets, and selections. Most importantly, the UI should offer the flexibility to combine these elements in various ways to freely extract any data they need without facing illogical restrictions.

For example, if a user selects a sport (like Football) and a region (like England) to find out the most popular tournaments, the algorithm provides a list of popular tournaments specific to English football. The key point is that the user cannot further narrow down this list by specific events, markets or selections within those games at this stage. The algorithm only offers that level of detail if the user chooses to view those specific lists separately.

Additionally, users should be able to filter this data based on specific timeframes and to differentiate between pre-match and live scenarios. The UI should enable users to specify the number of results they wish to view.

Solution

Screen 1 (Default)

The first step is to give the choice to the user - what data they ultimately want to view? An input search field is a good option here, with the rest of the field disabled.

Screen 2

Upon clicking the input search field, a dropdown of 5 options appears - Sport, Region, Competition, Event and Selection
Selecting an option will accordingly activate the rest of the dialog box - with logic driving this activation.

Screen 3

If user wants to view popular competitions, they select Competition from the dropdown.
They can also differentiate between pre-match and live scenarios.

Users can set the Sport and Region from the activated fields. Logically, the Events, Market and Selection fields will remain inactive.
They can also set the segments, time range and number of results they wish to see.

Screen 4

If user chooses to set the region to only England, they have a checklist of the dropdown to select from, a input field to type in.

This dropdown also comes with a Select All/Deselect All icon.

Screen 5

The Sport dropdown will have a similar dropdown as Region.

These active dropdowns - for Sport, Region, etc - contain multiple selection capabilities

Screen 6

For the above selections, the user will see popular competitions for both prematch and live scenarios, for the sports basketball, football, hockey and 2 more in England.

Right now, the segments, time range and number of results are set to “All” (default).

Screen 7

The time range dropdown consists of multiple options to set the required time range of the data.

User can view all time data, last week and last month’s data along with the option to customize the date range.

Screen 8

The Custom time range allows users to enter a start date (from) and an end date (to) between which they want to view and extract the data.

And also the final state of filters before the user clicks on Show Results. On clicking the CTA, the user will see the required data.

The reset button allows users to remove all selections and bring it to the default state of only the input search field remaining active.

Conclusion

The designed UI not only meets the core requirements of the Sportsbook users but also emphasizes user empowerment, logical data presentation, and adaptability to specific preferences. The result is a comprehensive solution that aligns with the user's need for flexibility, efficiency, and meaningful insights in navigating popularity data within the Sportsbook platform.

© 2024 alberdbrahma.

© 2024 alberdbrahma.